While world leaders continue their global climate summit in Glasgow, Scotland, one BC student is working to make the effects of climate change something we understand on a more local level.
Nikhilesh Radosevich, a junior at Bethlehem Central High School, is the creator of a website called earthstripes.org. The site allows users to learn more about the impacts of climate change in their own hometown with maps and a search engine that shine a spotlight on increasing temperatures, changing precipitation patterns and prevailing attitudes toward climate change in different communities across the country and around the world.
Visitors to the site can enter their zip code, city or county and readily find climate change information tailored to them and their location.
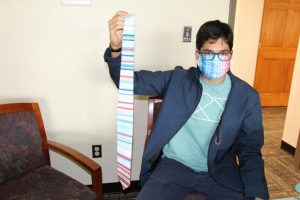
Radosevich also gives visitors a unique way to easily share what they’ve learned about what’s happening locally. He does this by partnering with online retailer Zazzle so people can purchase magnets, mugs, neckties and facemasks featuring a simple bar graph showing local warming data trends over 100-plus years.
With stripes in shades of blue (lower in annual temperature) and red (higher in annual temperature), the warming trends in any community are easy to see and easy to explain.
The teen got the idea for the website and for the location-based merchandise when he saw a local meteorologist wearing a striped tie showing the worldwide global warming trend. It turned out that a professor named Ed Hawkins at the University of Reading in the U.K. created the “Show Your Stripes” images using scientific data and the red and blue stripes to simplify the data and make it easy to understand.
Radosevich decided he wanted to do something similar but make it more personalized.
“When it’s more personalized to you, it lets you tell a better story,” said Radosevich.
Over several months, Radosevich created his website by overlaying data from the top science agencies and universities with map coordinates to create more targeted data and stories to help people understand climate change. Some of the sources used by Radosevich include the Environmental Protection Agency (EPA), the National Oceanic and Atmospheric Administration (NOAA) and a non-profit called Berkeley Earth.
He also uses information from the Yale Climate Opinion Survey 2020 to help describe a community’s attitude toward climate change by location. The survey shows that 78% of adults in Albany County believe global warming is happening, 6% higher than the national average of 72% of adults.